I started my career at Vedantu, where I worked on solving some of the observability platform problems related to scaling metrics, traces, and monitoring systems. In my limited experience, we were able to evaluate Prometheus, Cortex, Thanos, and VictoriaMetrics. We are going to go over the problems they solve. I had first-hand experience with this; we chose VictoriaMetrics. Later, I moved to slice, where we also use VictoriaMetrics.

Metrics solution?
You’re new to Kubernetes, and after a quick Google search on how to monitor the k8s cluster, the first thing you encounter is Prometheus. There are reasons why Prometheus stands out and garners such popularity: it is genuinely easy to configure, and you don’t have to do a lot of juggling if you’re just starting up.
Additionally, there are many helm charts available for easy installation; everything is out there. A wealth of exporters is also available. For example, if you want to monitor your node health, there’s Node Exporter; for k8s set metrics, there’s cAdvisor. So, at the start, we, like everyone else, chose Prometheus as our monitoring solution initially.

Prometheus: Basic Architecture

Kubernetes Nodes:
- These are the basic computing machines, physical or virtual, where Kubernetes runs.
- Inside these nodes, there are two primary metric sources depicted:
- Kube-state-metrics: This service listens to the Kubernetes API server and generates metrics about the state of Kubernetes objects (like deployments, nodes, and pods).
- Node CAdvisor: It provides resource usage and performance characteristics of running nodes.
- Prometheus is configured to pull metrics from these sources. This “pull” mechanism is a defining characteristic of Prometheus. Instead of services sending their data to Prometheus (push), Prometheus fetches or “pulls” data from the services it monitors.
Prometheus:
- This is the heart of the monitoring solution. Prometheus pulls in metrics from the defined sources, processes them, and then stores them in its database.
- Prometheus has been depicted with a link to a Persistent volume for metric storage. This emphasizes that while Prometheus holds time-series data in memory, it also persists them on disk.
Alertmanager:
- Once Prometheus has metrics stored and processed, it can evaluate alert rules. When certain conditions are met, alerts are fired.
- The Alertmanager takes over from here. It handles deduplication, grouping, and routing of alerts to appropriate channels.
- As depicted, the notifications can be sent to various external services, such as Slack and other webhooks, enabling team members to take appropriate action.
Grafana:
- While Prometheus provides its own basic visualization UI, Grafana is a more powerful visualization tool often used in conjunction with Prometheus.
Problems with Prometheus
Single point of failure:
- If you’re running a single Prometheus instance and it fails for any reason, you’re left without monitoring until the issue is resolved.
- Additionally, Prometheus is designed to be a single-node system. While it can be run in a high availability (HA) configuration, it’s not natively clustered. This means setting up HA involves running two or more identical Prometheus instances with the same configuration, which complicates things.
Long Term Storage:
- By design, Prometheus is not meant for long-term storage. It holds time-series data in memory and, while it does persist this data on disk, it’s more of a short-term solution.
- This setup is excellent for performance and real-time querying, but for organizations that need to retain monitoring data for long periods (e.g., for compliance reasons), additional solutions are required.
Have a single server for both scraping and visualization:
- In a default setup, Prometheus handles both data collection (scraping metrics from target systems) and visualization (via its built-in web UI). While this is simple and convenient, it can cause performance issues in large environments.
- In large-scale setups, having the same server handle data collection and visualization can strain resources, especially when many users are querying data simultaneously.
Searching for solutions:
The initial approach was to throw hardware at the problem, but this proved ineffective. We experienced multiple downtimes with the monitoring system and Prometheus wasn’t scaling. Recognizing that this wasn’t the ultimate solution, we began exploring alternative solutions. I’ll touch upon Thanos and Cortex, and then we can delve deeper into Victoria Metrics.
- Thanos: Thanos was the first alternative we considered. It addresses the long-term retention issue by using a remote backend via S3. However, the native S3 API doesn’t support a directory structure. As the number of objects in Thanos grows, managing them with the native API becomes challenging, turning Thanos into a bottleneck..
- Cortex: The next solution we explored was Cortex. In theory, Cortex appears very promising. It offers various components to address different challenges and has numerous moving parts. For us, managing all these components seemed overwhelming, making the system difficult to handle.
- Victoria Metrics: Then we came across VictoriaMetrics 🙌
Choosing Victoria Metrics
Each One Takes Care of One: Microservices. Breaks the overall task into multiple smaller tasks.
Levels of division:
- Storage and Querying
- Scraping
- Alerting
Details for Storage and Querying:
- VMSelect
- VMinsert
- VMStorage
Enter the Queen: VM Architecture
- Simple Components: Each component within the VM architecture is designed to be horizontally scalable. This implies that as the demand grows, more instances of each component can be added seamlessly.
- Clear Separation: The architecture distinctly separates write operations (data inputs) from read operations (data queries). This separation can be beneficial for performance optimization and system maintenance.
- Default Configurations: The system can run effectively with its default configurations, meaning there’s no need for complex custom setups or additional features.
- Scalable Storage: The storage, data ingestion (input), and read operations are designed for scalability. This ensures that the system can handle growing data volumes and user queries efficiently.
- High Compression: VM offers significant data compression capabilities, storing data with approximately 70% more compression. This can lead to considerable savings in storage costs and efficient data retrieval.
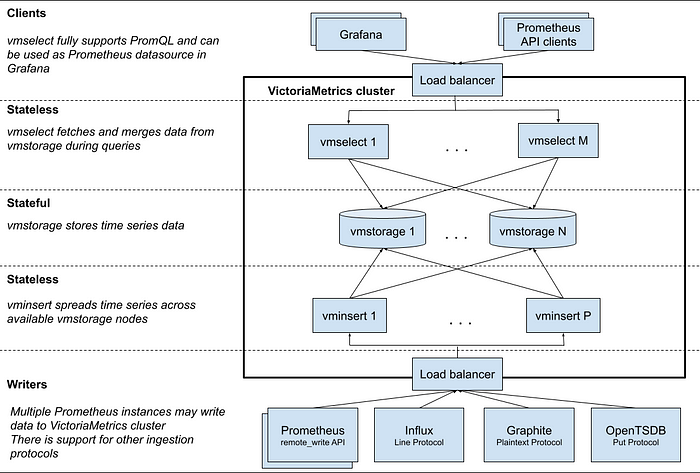
Clients:
vmselectfully supports PromQL and can integrate with Grafana as a datasource.- VictoriaMetrics cluster is structured with various components:
Stateless Components:
vmselect: Fetches and merges data fromvmstorageduring queries.vminsert: Spreads time series data across availablevmstoragenodes.
Stateful Component:
vmstorage: This is where time series data is stored. There can be multiple instances ofvmstorage, indicating a distributed storage setup.- A Load balancer is present, which helps in evenly distributing incoming traffic and requests across multiple servers or components to ensure no single server is overwhelmed.
- The Writers section has various Prometheus instances can write data to the VictoriaMetrics cluster. Additionally, it suggests support for multiple ingestion protocols, including Influx, Graphite, and OpenTSDB.
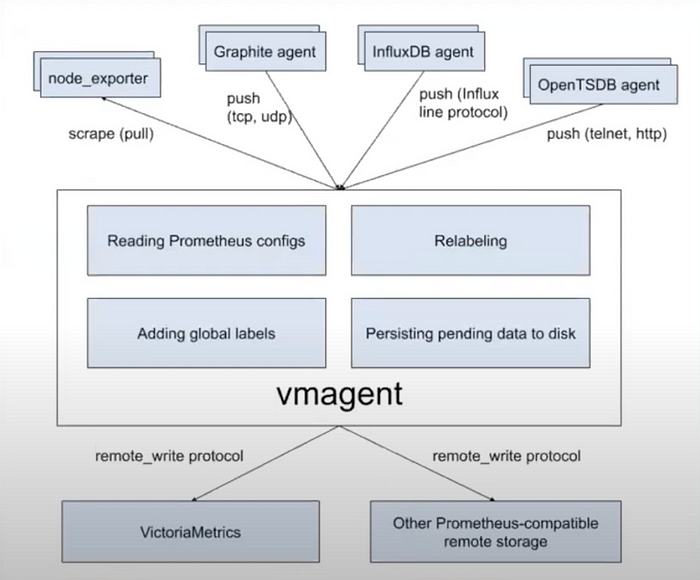
Replace Prometheus With VMAgent
Issues with Prometheus:
- Resource-Heavy: Prometheus can be demanding in terms of system resources, which can impact the performance of the systems it monitors.
- WAL Corruptions: Write-Ahead Logging (WAL) corruption issues can occur in Prometheus, which can lead to data loss or inconsistencies.
- Delay in Pushing Metrics: This means there might be a latency between the time a metric is generated and the time it is actually stored or made available for analysis.
Advantages of VMAgent:
- Light Weight: VMAgent is designed to be less resource-intensive than Prometheus.
- Prometheus Compatible: Even though it’s an alternative to Prometheus, VMAgent is compatible with it, which could mean it can either read Prometheus configurations or integrate with systems where Prometheus was previously used.
- Uses Less Storage: An advantage in environments where storage costs matter. This might be due to better data compression or efficient storage mechanisms.
- Stateless: Being stateless generally means that the agent doesn’t retain any information that affects its next operation. This can often lead to a reduction in complexities related to data persistence and recovery.
- Scalable: VMAgent can adapt to increasing workloads, which is essential for growing or dynamic environments.
AlertManager/VM Alert:
- Alertmanager is responsible for receiving firing alerts that are sent by VMalert.
- VMalert evaluates alert rules against Victoria Metrics and sends out firing alerts to all configured Alert managers.
- The received alerts can be managed effectively: they can be silenced or inhibited to ensure efficient alert handling and to avoid unnecessary noise.
Thanks for reading!